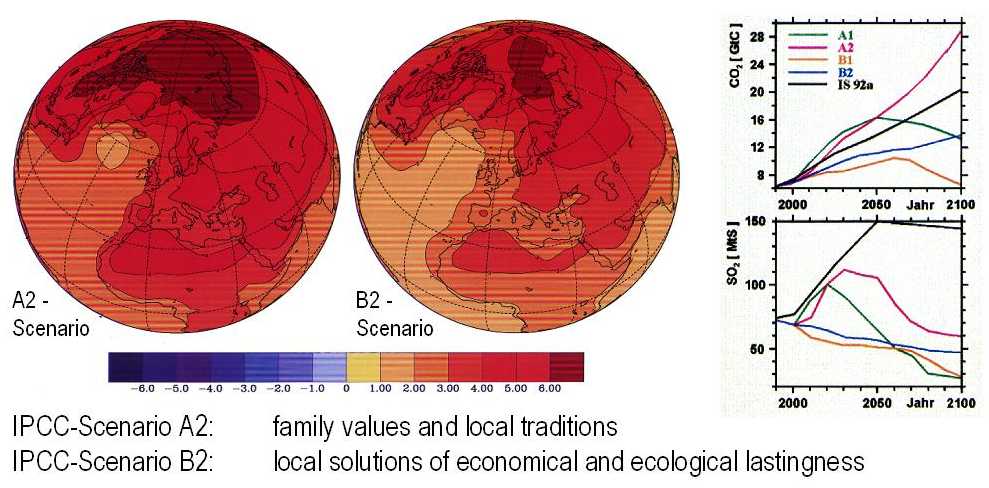
Most of the recent climate-models used to analyse the effects of the increase of carbondioxide and other greenhouse gases predict a significant warming of the Arctic, with a strong decrease of sea ice. Also, several trend analyses using newer i.e. satellite data have been carried out, many of them also showed a decrease. It is assumed that sea ice should be an indicator for thermal increase.
One of the problems with trend analysis is the fact that the observation period of arctic sea ice is very short. Consequently it is not known if the recent changing in the ice formation is just a short event or a longer trend. To enable the distinction between natural variances of the ice edge and human influence, some undisturbed information on sea ice are necessary. Many nations made ship observations of the sea ice for trading or military interests. Therefore, it is possible to get sea ice information of some areas from the last century. Older ice charts are not available. Also weather stations were rare at the polar-regions in the early time of synoptic weather observations.
Hence, for receiving pre-synoptic observations other sources must be used. Some of this work was done by KOCH, and later by OGILVIE using historical land sighting of Iceland, so did GLASER & KOSLOWSKI for the Western Baltic Sea, and HILL for the Newfoundland waters. Other similar studies were carried out by NEWELL for Labrador Sea. A further source of sea ice information is found in the method CATCHPOLE employed for Hudson Bay, TEILLET for Labrador Sea, and VINJE for the Spitsbergen area, they obtained ice-information from historical log-books. This study at the GKSS Research Center about the Ice at Kap Farvel also uses historical log-books of several archives.
Thousands of whaling ships sailed to Spitsbergen from the beginning of 17th century, to Davis Strait in the beginning of 18th century, and to the western Arctic in the middle of the 19th century. Furthermore, there were a lot of trading ships in the arctic regions, like ships to the Danish colonies at Greenland, as well as ships of the Hudson Bay Company. Each of the ships kept an own log-book, and some of these manuscripts, just a few, survived for centuries in several archives of different nations. The log-books contain infor-mation about the course, weather conditions - like rain, wind, and color of the sky - things that happened onboard, and also sea-ice sightings.
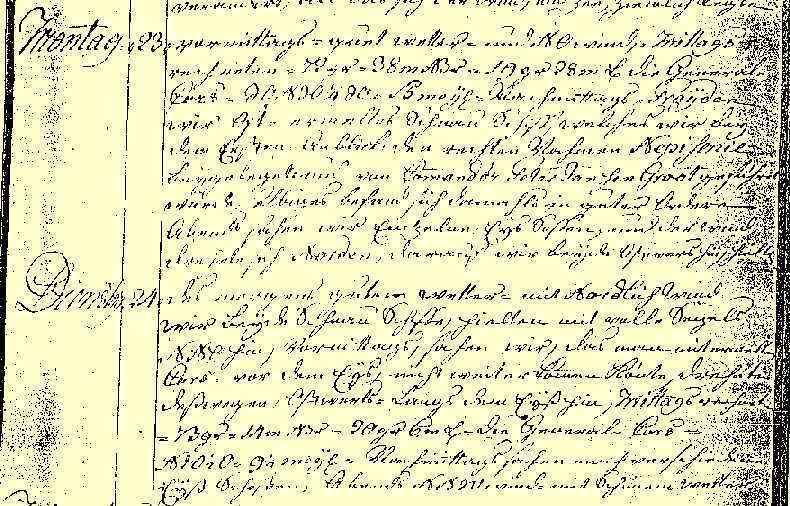
It is very difficult to get useable information from one single log-book, often the observations are rather poor, but together with other ship observations and possibly land descriptions, it is a rich source. In this study, the ice observations are put into a Data-Bank together with cited original words, following the HISKLID (Historical Climate Databank) example of University of Wuerzburg. This Data-Bank allows the addition of ice information each time new material is found, without the risk of unknown interpolation. The original words makes the interpretation of the chart editor comprehensible. In future it will be possible to join this ship observation data bank with modern Geographical Information Systems.
At present the Data Bank contains several thousand observations of the Spitsbergen Area and the Area of South-Greenland, collected from American, Danish and German Archives. If possible observations of British and Dutch ships will be added in future.
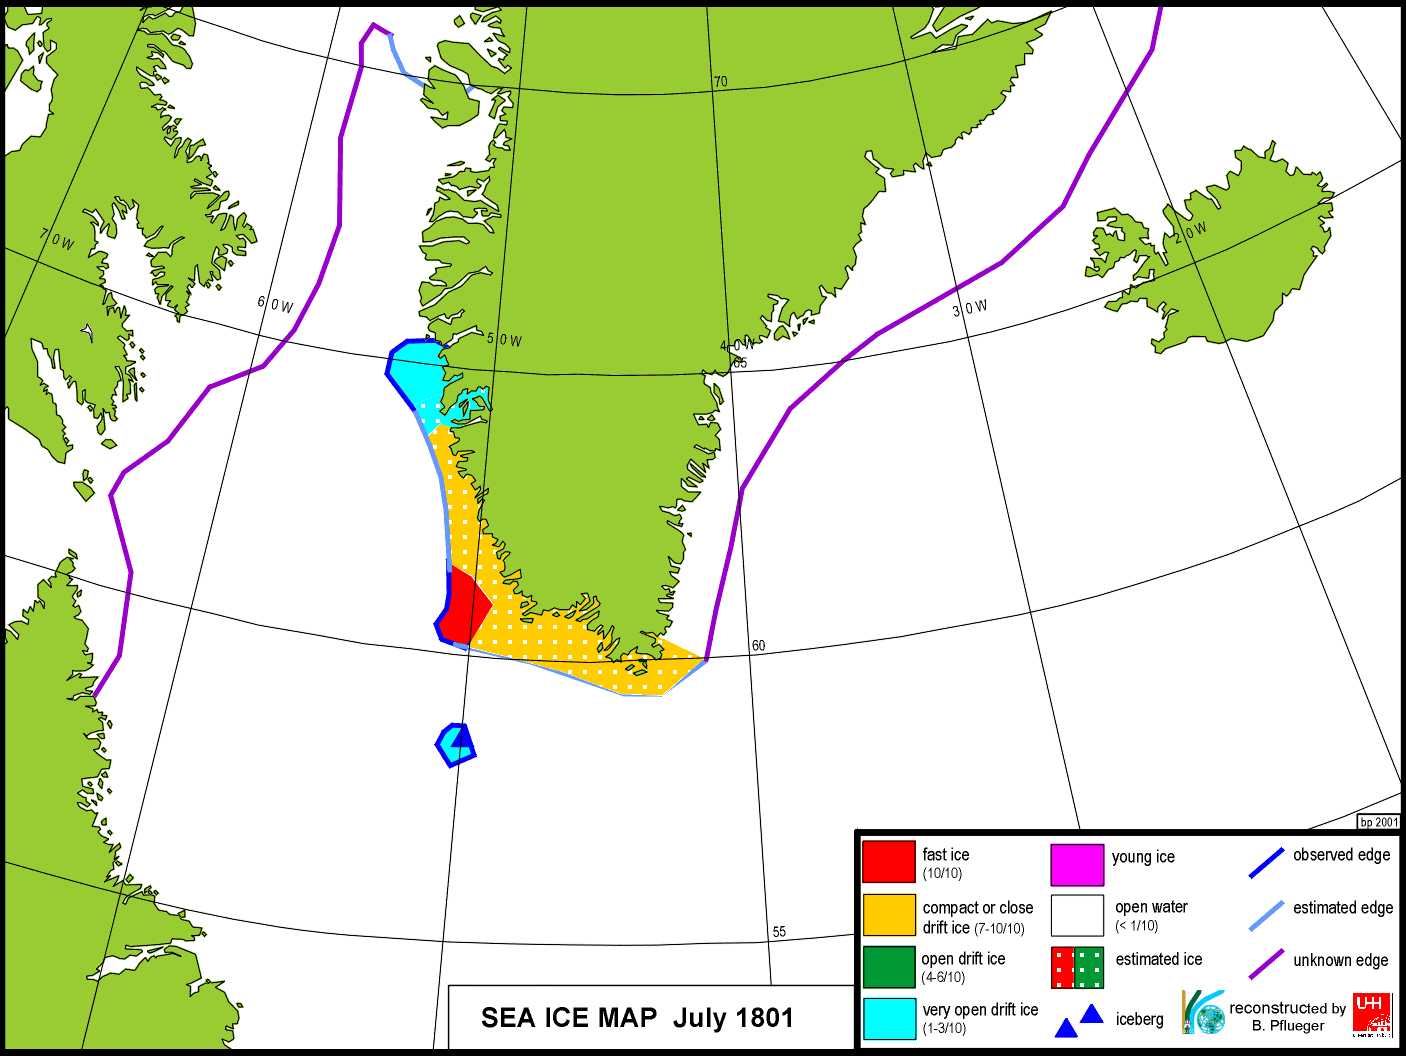
A long-time-series of the summer-ice edge, for the ”Storis” of Kap Farvel, the South Cape of Greenland is still under construction. About 240 ship-logs between 1777 and 1802 survived at the Danish Empire Archive at Copenhagen and represent a solid stock of information for these years. Other sources such as the ice-charts of the Danish Meteorological Institute or the NSIDC-Sea-Ice-Atlas closes the gap to the present day. Therefore it is possible to produce an almost continuous 225 year time series of the drift ice at Kap Farvel. As a result, e.g. the year 1780 can be proved to be poor in ice formation, whereas a couple of years with strong ice formation are timed between 1798 and 1802.
The ice reconstruction will be compared at GKSS-Research Center to the output of a climate simulation of the last 500 years with a state-of-the-art climate model driven by estimated solar variability, atmospheric concentrations of greenhouse gases and the effect of volcanic aerosols on the radiation balance.
Projektmitarbeiter / Projektleitung:Börge Pflüger
Dietbert Thannheiser
| Arktisches Meereis | | | COLECC-Sea-Ice-Project (English) | | COLECC-Meereisprojekt | | Links |